Arcadis Sustainable Cities Mobility Index 2017
Nigel, our e-correspondent from New Zealand, shares with us a report, Chasing Urban Mobility: Moving towards a connected sustainable future | Arcadis Sustainable Cities Mobility Index 2017.
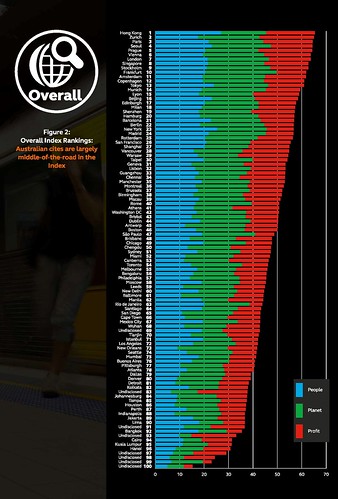
This ranking of sustainable mobility is of cities specifically, not metropolitan areas, and lists the top 100 cities world-wide in. The organization is Australia-based and the report includes a section on what Australian cities can learn and how to do better.
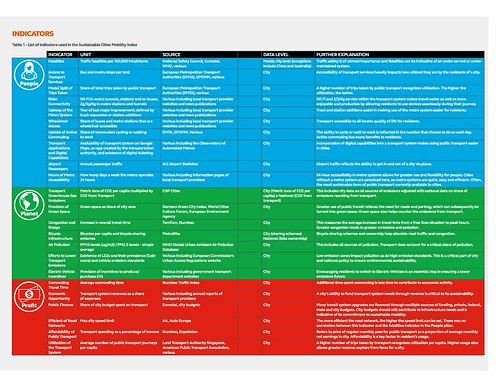
The index is produced using data organized in three different categories:
- People: Measures social and human implications of mobility systems including quality of life
- Planet: Captures environmental impacts; “green” factors like energy, pollution and emissions
- Profit: Assesses the effi ciency and reliability of a mobility system to facilitate economic growth
For example, DC (#42) rates more highly than Melbourne (#55), yet Victoria State invented "transportation demand management" and the Melbourne transit system is rich and deep, with a number of world leading practices in pricing mechanisms to promote use of transit, such as riding trains free for trips that end before 7:15 am, as a way to manage transportation capacity more than as a revenue generator, plus it has the Parkiteer bicycle parking network, which operates at the metropolitan scale, providing free, protected bicycle parking at transit stations and major destinations, as well as an organized overnight transit network operating at the metropolitan scale, whereas DC proper has a default overnight transit network because a number of trunkline bus services run almost 24 hours, but this doesn't extend to the suburbs.
Plus, cities with practically no real transit systems at all other than lightly used bus systems, like Detroit, Tampa, and Indianapolis, are ranked in the 80s, which makes little sense. But this is likely a "fault" of the cities selected for study. The US is overrepresented with 19 cities listed, while countries like Germany (3 cities) and France (2 cities) are underrepresented.
Still, if you measure "sustainable mobility" on the basis of "in the center city, you can get around and make most of your trips without having to own a car" probably the top 55 cities fit the bill. Certainly on the basis of experience in places like Hamburg (#20), New York City (#23), San Francisco (#26), and Montreal (#36) I can say that's true, although taxis and car share vehicles can help to make it even easier.
And the measurements are a good start, even if the data sources may need changing.
Indicators for measuring sustainable mobility, Arcadis Sustainable Cities Mobility Index 2017 (page 19)
Top 100 cities, Arcadis Sustainable Cities Mobility Index 2017 (page 9)
Labels: green-environment-urban, sustainable mobility platform, sustainable transportation, transportation planning, urban design/placemaking
posted by Richard Layman @ 7:43 AM&Permanent Link
![]()
![]()


0 Comments:
Post a Comment
<< Home