Housing + Transportation Affordability Index, Sprawl and Energy and the Environment

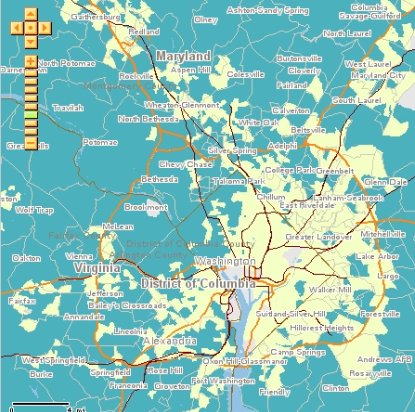
Housing and Transportation Affordability in the Washington Region. Beige = housing + transportation costs less than 45% of household income. Blue = H + T costs equal to or greater than 45% of household income. CNT map.
1. Check out the maps from the Center for Neighborhood Technology. The eastern side of the city and region come out very well in these equations--although public transportation could be a lot better in Prince George's County.
2. And this piece on location efficiency from the Congress for the New Urbanism.
3. Christopher sends us this piece, "Discouraging driving crucial in warming battle," from the San Francisco Chronicle, which states:
A sweeping plan to carry out California's landmark law to fight global warming, made public Thursday by the state's air board, addresses a problem that planning groups say has been overlooked in most federal legislation: suburban sprawl.
The draft plan, which seeks to cut greenhouse gas emissions in the state by 30 percent by 2020, encourages local governments to create land-use and transportation plans that help them meet reduction targets. The idea is to discourage driving by concentrating development in urban areas near transit, jobs and retail or by laying out suburbs more efficiently.
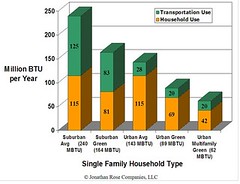
Efficient use of energy and reduction of our impact on the earth is all about linking housing and activity centers in efficient ways. Land use decisions made independent of transportation considerations are likely to be flawed if they are dependent on automobility and cheap gasoline.


0 Comments:
Post a Comment
<< Home