D.C. cuts speed limit to 20 mph to curb pedestrian deaths: a step forward but not enough | New thoughts on a comprehensive Vision Zero agenda

Neighborhood Slow Zone street sign, 4th and C Streets SE, Capitol Hill, Washington, D.C. I haven't seen such a sign elsewhere in the city. I don't know if it was a pilot case.
Today, DC announced that starting next week, the prevailing speed limit -- unless posted otherwise -- will be 20mph ("D.C. cuts speed limit to 20 mph to curb pedestrian deaths," Washington Post.
Currently, the prevailing speed is 25mph, and the posted speed is often 30 mph on major arterials, especially as you move outside of the core.
Interesting.
Years ago, when then Councilmember Bowser and Councilmember Wells suggested that the prevailing speed be 15mph, I said that was too slow, that 20mph would make sense, especially for residential streets.
-- "A more radical approach to Vision Zero," 2019
-- "A reminder about how the entitlement of automobility is embedded into law and democratizes death by accident," 2014
-- "A "Vision Zero" agenda for DC," 2014
-- "DC and Vision Zero Revisited," 2015
-- "Updating Vision Zero approaches," 2016
-- First global benchmark for road safety in cities published by International Transport Forum," 2018
-- "Pedestrian fatalities and street design," 2019
In "Updating Vision Zero approaches" I reorganized the recommendations into categories modeled after the "6 E's" of bike and pedestrian planning, but with some modifications:
-- Planning/Placemaking
-- Engineering and Maintenance
-- Education
-- Encouragement
-- Enforcement/Traffic Engineering
-- Equity
(The Sustainable Mobility Platform concept I've been developing includes pedestrian elements. It needs an update too.)
Now they're doing it. Except according to the article Mayor Bowser hasn't given up on 15mph:
Bowser also announced a “slow streets” initiative through which some neighborhood roads will be restricted to local traffic only and have a posted 15 mph speed limit. The District Department of Transportation is identifying locations, Bowser said.I have some concerns about this, especially in the core of the city, because the strength of the mobility network is the grid of blocks and streets, and if the grid gets more disconnected, this can have other negative elements.
Similarly, I've suggested that signage about the city's prevailing speed limit, which is lower than the surrounding suburbs, should be posted at entry points to the city, especially main arterials like Wisconsin, Connecticut, Georgia, and Rhode Island Avenues, 16th Street, East Capitol and South Capitol Streets, etc.
Given the new directive, it's worth listing the recommendations from the "Enforcement/Traffic Engineering" element:
Enforcement/Traffic Engineering
In this section I've added traffic engineering as an element slightly different from the kinds of infrastructure facilities typically covered under the "Engineering" E.

26. Put signage up at the major entry points into the city, stating that the prevailing speed limit is 25 mph, unless posted otherwise.
27, Make residential street speed limits 20 mph.
28, Change the speed limit around transit stations to 25 mph (or 20 mph).

Image from Streetsblog.
30. Change the legal framework with regard to motor vehicle operation to require that automobiles--as the heaviest and most powerful mobility device--should be accorded the greatest amount of legal responsibility with regard to traffic accidents.
31. Up the penalties for vehicle accidents that injure, maim, or kill, regardless of intent.
32.. Retrain police officers with regard to bike and pedestrian accident analysis so that their default position is not "the pedestrian/the bicyclist is automatically at fault."
33. Legalize the Idaho Stop for bicycling.
34. Consider the development of a bicycle operators endorsement for drivers licenses.
35. Bring back the traffic enforcement division of the police department as a special unit. (Note that the Motor Carrier Safety Unit still exists, although it's probably a federal requirement.)
36. Give parking enforcement officers the training and legal authority to ticket driving infractions.
37. Advocate to the Consumer Product Safety Commission for the inclusion as original equipment front and back lighting, and left and right turn signals on bicycles intended for urban transportation use
I guess with this change by the city, I should go back and do a re-read of the Vision Zero agenda and update it. Certainly if the city can change the speed limit, it can legalize the Idaho Stop.
Here are two items on my mind.
Big data and targeted traffic safety initiatives. In comments on one of the entries, charlie made that point that the big issue is really addressing in a systematic way the people who are likely to be the worst/most dangerous drivers.
While I have been derisive of "big data" approaches at times, figuring that the "gee whiz" element of big data is used when regular but systematic techniques are capable of similar "revelations," it's just that no one is focused on transformational practice, focused efforts on dangerous drivers is a big opportunity for big data ("Real-Time Data Analytics Aims to Reduce Traffic Fatalities," Government Technology).

I have written about it here and there ("Barnes Dance Intersections as possible "solutions" to Wisconsin & M, 14th and U intersections," 2016) but now I am thinking about it more comprehensively, including the addition of mid-block crosswalks where needed (L'Enfant's plan for the city's streets made some blocks double and triple the size of a normal block).
I made the point in my writings on Silver Spring, Maryland, as point #4 in this entry, "PL #5: Creating a Silver Spring "Sustainable Mobility District" | Part 2: Program items 1 - 9."
Create a network of pedestrian scramble intersections, where one designated signal phase is exclusively for pedestrians: on Colesville Road at East-West Highway, Second Street, Georgia Avenue, and Fenton Street; on Fenton Street at Ellsworth, Wayne Avenue, and Bonifant Street; and at the intersection of Wayne and Georgia Avenues. And a more defined crosswalk treatment should be provided at the mid-block crossing at Ellsworth and Georgia Avenues, crossing east-west.
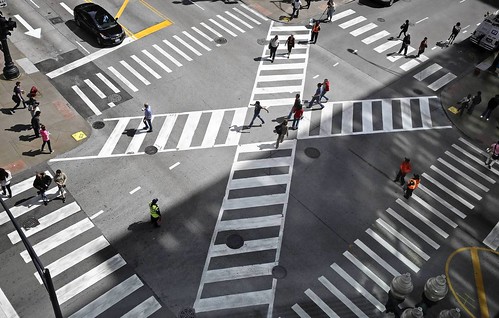
Pedestrian scramble, Jackson Boulevard and State Street, Chicago. Photo: John J. Kim, Chicago Tribune.
While the road network prioritizes motor vehicle throughput, some places have far more pedestrian traffic than motor vehicle traffic. One way to better balance movement for pedestrians is to provide a "pedestrian scramble" or "Barnes Dance" intersection treatment where one phase, including diagonal crossing, is exclusively for pedestrians.
Back when Downtown DC was the region's primary shopping and office district, DC had multiple such intersections. More recently, one was created at 7th and H Streets NW and one is being installed at 14th and Irving Streets NW. I have argued that DC needs multiple such intersections as a traffic safety and mobility rebalancing intervention ("Barnes Dance intersections as possible solutions").
There is also a mid-block pedestrian crossing on Georgia Avenue at Ellsworth (which doesn't continue west across Georgia Avenue) which needs a more defined crossing treatment comparable to markings for the street crossings on the Indianapolis Cultural Trail.
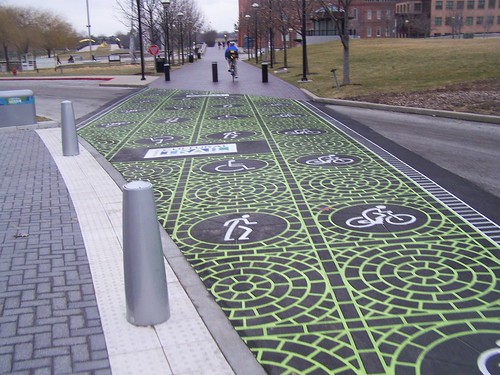
The ICT is marked by high quality markings at street crossings, making very clear the prioritization of non-motorized mobility.
This should be added to the Vision Zero comprehensive agenda as an additional element within the section on Engineering.
For example, all of the crosswalks from:
- the 200 block to the 1500 block of Pennsylvania Avenue SE
- on H Street NE from the 300 block to the Maryland Avenue intersection, and continuing from that point on Benning Road NE to Oklahoma Avenue NE
- on 14th Street NW from Thomas Circle to Spring Street at the edge of Columbia Heights
- and so forth -- e.g., Connecticut Avenue, M Street, Wisconsin Avenue, Georgia Avenue, etc.
The failure to think this way is a major omission in city transportation planning in DC and elsewhere.
Another place I've suggested this is in Takoma DC on Cedar Street from where it terminates at Piney Branch Road at the Takoma Elementary School to Old Town Takoma Park.
But there are dozens of places across the city with similar conditions and opportunities.
=========
Also see:
-- "Activists block off DC streets to create socially distant outdoor space," WTOP radio
-- "Boston 'Healthy Streets' program to include bike lanes, bus stop expansion, outdoor dining," WCVB-TV
-- Boston Healthy Streets program
Labels: bicycle and pedestrian planning, sustainable mobility platform, traffic engineering, traffic safety and enforcement, urban design/placemaking, Vision Zero
posted by Richard Layman @ 6:29 PM&Permanent Link
![]()
![]()


5 Comments:
https://www.washingtonpost.com/opinions/local-opinions/dc-doesnt-have-to-become-more-car-centric-after-the-pandemic/2020/05/28/ed0edaf2-99e7-11ea-ac72-3841fcc9b35f_story.html
NYC: crashes and deaths down, but seriousness of injury increases
https://www.bloomberg.com/news/features/2025-05-09/nyc-s-streets-saw-serious-injuries-rise-as-traffic-returned
What’s Behind the Rise in Serious Injuries on New York City’s Streets?
Pedestrians, cyclists and drivers all saw elevated injury rates in the last three years, despite the city’s decade-long commitment to Vision Zero safety reforms.
The numbers revealed a distinctly uneven geography of risk. The increase was most pronounced in Queens, where the number of pedestrians seriously injured by motor vehicles jumped by 29% in three years’ time. Severe crashes were 19% higher per capita than the citywide average in the top 10 Latino districts and 23% higher in the top 10 low-income districts. The Bronx, in particular, had 20% more serious injuries overall per capita than the city writ large.
And while 2023 was the safest year on record for pedestrians in New York City, it was also one of the deadliest for cyclists. Experts attribute that to the growing popularity of e-bikes and e-scooters, which out-accelerate their pedal- or push-only predecessors. E-bikers made up almost three-quarters of cyclist deaths that year.
E-bikes — especially those operated by delivery workers — have been the focus of safety concerns since their arrival on NYC’s streets. A recent policy change will see the city’s police department issue criminal summonses instead of traffic tickets to cyclists who ride recklessly; officials specifically cited e-bike users as the target. For those on foot, the sudden omnipresence of e-bikes has heightened a sense of insecurity.
... But there’s little evidence that they contribute significantly to reported injury rates for pedestrians. According to the police’s database of motor vehicle collisions, of the 9,610 New York City pedestrians injured in 2024, only 37 involved e-bike collisions. Seeing e-bikes flying down sidewalks or riding against the flow of traffic certainly contributes to the streets’ disorderly vibes, but the dangers they pose pale in comparison to a two-ton vehicle.
Further complicating the narrative: If you consider how many more users of e-bikes, pedal bikes and other micromobility vehicles there are now, per-capita injury and death rates have dropped. And yes, it’s true that New York City is back to pre-pandemic levels of overall traffic violence — but children are dying at disproportionate rates. What you’re left with is a “yes, but” zero-sum game.
In part, the recent rise in injuries reflects the sharp decline in vehicle traffic during 2020 and 2021. As vehicles returned, the amount of regular tragedy on roadways has returned to a steadier hum, says Marcel Moran, a mobility researcher at New York University. “We had this huge destabilization event, in terms of transportation behavior, with Covid,” Moran explained to me. “But we’re now fully on the other side of that. Behaviors have resumed, with just a few changes.”
Public transit ridership still hasn’t fully returned, but car usage did — and that rate remains higher, as commuters who purchased cars during the pandemic have kept up the habit. Driving also tends to be linked with economic activity; growth is intertwined with mileage. Until that’s decoupled, Moran argued, Vision Zero will simply hit a wall of what’s possible.
The Injury Factor
When we talk about dangerous streets, we often think exclusively in terms of deaths. But Jack Greenwood, a research associate at Transportation Alternatives who led the study, notes that there’s a less-remembered second clause to Vision Zero — it’s a strategy to eliminate all traffic fatalities “and severe injuries.”
These areas often lie in more car-dependent areas, where street safety reforms, whether in the form of traffic restrictions or automated enforcement devices, trigger resistance from residents and local officials alike.
Enforcement is another sticking point. Safety advocates point out that speed cameras can’t save lives if the most reckless drivers — the extreme recidivists known as super speeders — routinely ignore the penalties, which appears to be the case.
As in other US cities, New York’s streets are increasingly plied by vehicles of greater size and power, a trend frequently cited as a contributing factor in the US pedestrian safety crisis. “When we talk about electric vehicles, too, we always like to point out, too, that EVs are heavier,” Lind said. “So they’re also leading to more injuries, serious injuries, and deaths.
... And while street safety was never a major focus of the program, it appears to be helping nevertheless: Roads inside the congestion relief zone saw a 51% drop in injuries and a 55% drop in crashes year-after year in January, according to Streetsblog.
=====
New York City Just Had Its Safest-Ever Year For Pedestrians. What Went Right?
Ten years after New York became the first US city to adopt the Vision Zero traffic safety model, transportation authorities and activists see progress and frustrations.
https://www.bloomberg.com/news/features/2024-03-11/new-york-city-s-decade-long-battle-for-pedestrian-safety
Not long ago, a pedestrian was hit and killed by a car just about every day in New York City. Even as traffic fatalities declined overall in the US in the early 1990s, New Yorkers were being killed by cars at nearly double the national rate. In 1990, the death toll exceeded 700, and half of those victims were on foot. “What is wrong with New York?” the New York Times asked in 1993.
Making extensive redesigns can be a bumpy process. Minor traffic-calming measures might be well-received by residents. But take away a parking space for a bike or a bus-only lane? Not so much. Efforts are halted by hesitation or even outright opposition from local reps and community boards. (When 51 Council Members were recently asked to recommend corridors in their districts for street improvements, only six replied to NYCDOT.)
As a result, advocates say that agency planners often find themselves in a no-win position, as larger, more ambitious projects are pitched in a vacuum.
Scaling the Solutions
Talk to people about problems in New York City and you’re going to hear the word “scale” a lot, in both noun and verb forms. Just by sheer size, anything here carries precedence, and indeed, New York City’s streetscape plans stand alone among North American cities.
While Covid-era street changes like outdoor dining structures and traffic-restricted open streets largely faded elsewhere, they’re still a thing here, albeit somewhat diminished. New York City’s automated enforcement program is also the most extensive in the US, with about 2,500 speed cameras. The Big Apple has the most bike lanes and greenways, and the most car-free events like “Summer Streets” and “Trick or Streets.”
But thanks to its enormity, in many ways New York still has far to go. Just 3% of its streets have protected bike lanes, for example; red light cameras are only installed at 1% of its intersections. And most New Yorkers scoff if you tell them that the streets are getting safer — the result of a lived experience where near-misses and mishaps remain routine.
“I often think of New York as a terrible startup, where we knock it out of the park in the first round with this amazing prototype but we can't actually scale the success,” said Harris of Transportation Alternatives. “So we’re constantly telling these stories of what we did before. New York City doesn't need to always be the city that’s doing something flashy or new. We have the tools that work, and while that might be less sexy, that’s actually to make this a more equitable city, address our climate issues and make it safe for everybody.”
But there are some big caveats to this success story. Total traffic fatalities in New York City remain high, and drivers are dying in crashes at greater rates than before, thanks to a spate of dangerous speeding and bigger vehicles, experts say. So are bicycle riders, with fatal crashes involving cyclists at a 23-year high. The rising number of electric bikes has been cited as a factor — 23 of the 30 cyclists killed in 2023 were on e-bikes, mostly in vehicle collisions on roadways that lack bike lanes. An average day on New York City’s streets still carries about eight serious injuries.
And while New York City’s improvement in protecting pedestrians is worth noting, so is the even-more-impressive record assembled by close neighbors like Hoboken, New Jersey, which just celebrated its seventh year without a single traffic fatality. (Nearby Jersey City has also had an impressive streak.)
================
Mapping the ‘Super Speeders’ of New York City
A growing share of drivers ticketed by the city’s network of automated traffic enforcement devices are collecting hundreds of violations, a new study shows.
https://www.bloomberg.com/news/articles/2024-02-09/nyc-s-speed-cameras-reveal-super-speeders-on-the-rise
In new data published this month by New York University transportation researcher Marcel Moran, “super speeders,” or drivers who clock over 100 infractions for going 10 miles per hour (16 kilometers per hour) or more above the speed limit, are gobbling up a greater share of New York City’s speed camera tickets each year. In 2020, when the city had 1,300 of the automated traffic enforcement devices scattered across the boroughs, only four drivers qualified for the title; by 2023, with almost double that number of cameras installed, that figure had ballooned to 186. (The record: 373 tickets from one driver alone.) Last year, fewer than 200 drivers accrued the same number of speed camera tickets as the bottom 25,000 drivers.
New York City’s speed camera program is now a decade old, launched as part of the Vision Zero agenda Mayor Bill de Blasio signed onto as one of his first moves in office in 2014. The cameras first appeared in school zones — 20 in 2014 and about 750 today, with about 2,500 cameras citywide. In August of 2022, Albany allowed New York City to begin operating them 24/7, instead of just from 6 a.m. to 10 p.m.
In the first 12 months after this expansion of enforcement, the cameras clocked 33% fewer tickets per hour, even as the overall number of people ticketed grew. The city’s Department of Transportation says that most drivers now stop getting tickets after one or two, which the data confirms. “That tells us the average person is driving slower,” Moran said. “But if you dig into the universe of those accruing tickets, a second thing is happening.”
In that same time period, extreme recidivists clocked a 234% hourly increase in camera-based tickets. (The new overnight window also made up almost 40% of violations for them.) They once made up a fifth of all speeding tickets; now it’s closer to four-fifths. Super speeders owe an average of $11,083 each in unpaid fines.
To Moran, the persistence of this particularly incorrigible cohort of reckless drivers exposes a weakness in the program. “A well-designed system would show the opposite: A driver gets a ticket and then doesn’t get it again,” he said. “So I think that New York has succeeded in one of its objectives. But the other piece is, ‘What do we do about the extremes?’ That’s when the penalty design really becomes suspect.”
Post a Comment
<< Home