20000/600000 = 3.3% | No, probably WMATA doesn't have an adequate ridership improvement action plan
One of these days I will write more about WMATA's significant loss in ridership, both on train and bus. I've written so much about the broad issues in the past that it becomes difficult to try to figure out the specifics now:
- other than unreliable service
- extended shutdowns for rail system rebuilding
- and much less frequent service
- complemented by high cost of Metrorail + bus fares
- and the fact that unlike a car or car sharing or a taxi when riding with multiple people the cost increases
- plus increased critical mass of locally-reached amenities in neighborhoods reducing the demand for longer journeys requiring transit
- a soupçon from the significantly reduced frequency of rail service at night and on weekends discouraging transit use in significant ways--it no longer serves as the "top of mind"* mobility choice
- which in turn increases the use of alternate modes like car sharing and taxi/ride hailing.
 But I am not sure that today's Post article, "Metro says it doesn’t know what to do about falling ridership. An internal report lays out exactly what to do," is particularly helpful in getting us to the solutions.
The article is a follow up to an earlier one, "When it comes to reversing the ridership slide, Metro's leaders don't have a plan."
But this could be the headline writer's fault...
The article discloses an internal memo, and argues that an agenda for ridership improvement has already been developed by WMATA staffers. The memo appears to be quite good at understanding the root of the problem.
-- Stabilizing and Growing Metro's Ridership, WMATA, May 2018
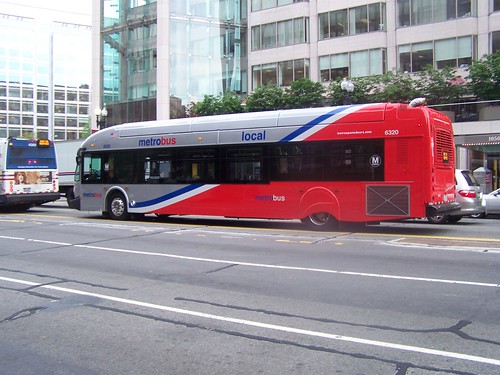 The system used to have about 700,000 daily subway trips and 500,000 daily bus trips and it's significantly less than that now--616,000 daily train riders and 370,000 daily bus riders in 2017 on average, according to the memo.
But the number of additional trips projected as a result of the proposed measures is small relative to the drop off in rail ridership.
An increase in daily ridership of 20,000 is a percentage increase of 3.3% on current ridership and recovers about 25% of the total number of lost rail riders.**
I don't think that level of outcome would meet the commonly accepted definition of "exactly what to do," because the other 75% of lost riders are still lost.
=========
* "Top of Mind" as a marketing term. When doing market research, there is what is called "top of mind" answers, where you ask the question "what radio station do you listen to?" and the person says WAMU NPR or Magic 102.3 unprompted. That's also called "unaided." Then you ask, "do you listen to [specific stations, like WTOP etc.] and they answer.
In mobility, if I were to be asked how do I get around primarily, my "top of mind" response would be "bike," then "car sharing," then "subway."
In what we might call WMATA's best markets for potential customers: DC; the Rosslyn-Ballston corridor in Arlington; and probably from Rockville to Bethesda in Montgomery County; in DC and Arlington specifically there are an increasing number of amenities located within a 2 mile radius of neighborhoods and people aren't likely to use transit to get there.
** In David Halberstam's book The Best and the Brightest about the Vietnam War, he recounts an anecdote of how the US Army was reporting a constant stream of victories in battles, but when a journalist mapped the location of each of the "victories" he realized that the land area controlled by the US/South Vietnamese was shrinking relative to the Vietcong/North Vietnamese.
Labels: market research, sustainable mobility platform, transit planning, transit riders
posted by Richard Layman @ 8:58 AM&Permanent Link
Follow this blog
3 comments