Rebuilding Place in the Urban Space

"A community’s physical form, rather than its land uses, is its most intrinsic and enduring characteristic." [Katz, EPA] This blog focuses on place and placemaking and all that makes it work--historic preservation, urban design, transportation, asset-based community development, arts & cultural development, commercial district revitalization, tourism & destination development, and quality of life advocacy--along with doses of civic engagement and good governance watchdogging.

Wednesday, June 15, 2016

A regional transit map for Greater New York City

Regional transit systems tend to be comprised of separate systems operated by different organizations.  In Germany especially, they are organized into "transport associations" and the association provides a certain level of high level cross-jurisdictional planning, and integrated marketing and fare media systems.

In the US, a couple areas have integrated systems, for the most part, but most do not.  For example, within Philadelphia, SEPTA runs subway, streetcar, buses and commuter rail, but NJTransit and PATCO also serve Philadelphia as a destination, and some SEPTA train services run into New Jersey and Delaware.

In Greater Boston, MBTA runs all the transit services, including railroad and ferry.  One railroad line provides service to Rhode Island and there is planning underway to extend service further into Rhode Island as well as to points in New Hampshire by extending the Lowell commuter railroad line.  But the transit card doesn't normally work for railroad services, excepting certain pass options.

In most other places, that isn't the case, although the desire for integrated fare media systems, depending on whether or not railroads also offer weekly or monthly passes, is moving areas towards the creation of a more integrated transit framework.

For example, in the SF Bay area, their transit card can be used on the regular transit systems as well as Caltrain, the area railroad system.  In the Puget Sound, the Orca card can be used on ferries as well as the Sounder commuter railroad, in addition to other transit services.

As Metrolinx in Greater Toronto works towards implementing an integrated fare media card system covering all of the transit services there, including the GO railroad and commuter bus programs, the issue of offering transfers without a charge poses question for some of the systems, like the TTC in Toronto, which doesn't offer free transfers to riders of systems that originate outside of Toronto ("Metrolinx wrestles with what fare is fair" Toronto Star).  From the article:
For more than a year and a half, Metrolinx, the Ontario government’s regional transit agency, has been working on a plan to merge the fare systems of the Greater Toronto and Hamilton Area’s nine municipal transit operators, as well as GO Transit.

It’s a project that could transform the daily routines of millions of transit riders from Hamilton to Oshawa, and the Ministry of Transportation says it’s key to the success its plans to increase mobility in the GTHA.

“Gridlock and congestion doesn’t respect area codes or municipal boundaries,” Transport Minister Steven Del Duca told the Star in an emailed statement.

“In order to support the unprecedented transit investments that the Ontario Liberal Government is making, we need a fare integration system across this entire region that works seamlessly.”

The goal of integration is to enable transit users to go to their nearest transit stop, pay their fare using the new Presto fare card, and never notice if they transfer onto another municipality’s system.

Integration is necessary, Metrolinx says, because more than 22 per cent of the GTHA’s nearly 2 million daily transit riders cross a municipal boundary, and thousands of them pay a penalty for it.
The TTC is concerned because if they were to offer free transfers this could cost them up to $40 million in revenue, and would be a subsidy to non-residents.

The DC and Baltimore region has an integrated fare media system using WMATA's SmarTrip card (called CharmCard in Baltimore), but the one service that is excluded is passenger rail as neither VRE in Virginia nor MARC in Maryland participate ("One big idea: Getting MARC and Metrorail to integrate fares, stations, and marketing systems, using London Overground as an example").

The draft of the DC State Rail Plan recommends developing an integrated fare media system to include the rail passenger services.

Graphic by Mattias Mackler from Capital showing rapid transit services in Greater New York as if they were one integrated system.  

New York City.  When the Super Bowl was in New Jersey in 2014, more people became clued into the fact that the NYC Metropolitan area has different transit systems that don't share fare media systems, and aren't usually depicted on one map.

The NYC Transit card works on NYC services, and PATH, the old Hudson & Manhattan electric railroad service from Newark to New York City, but not on the Metro-North and LIRR railroads, and not on New Jersey Transit services.  On the New Jersey side, NJTransit runs railroad passenger services, and two different light rail systems (the one in Newark used to be a streetcar line).  The PATH system is run separately by the Port Authority (and it loses a lot of money, "PATH could be targeted for privatization, service reduction under Port Authority plan embraced by governors," Newark Star-Ledger).

This ended up being an issue for the Super Bowl because while the game was in New Jersey, most of the big pre-game festivities were in New York City.  See "The power of understandable graphics: integrating NYC-area railroad passenger services."

The magazine Capital ran a story on the problem, "Beyond Local" and included a map graphic showing the concept.

It turns out that MTA, working with transit services in New Jersey, recognized the problems likely to occur during the Super Bowl in terms of people understanding how to get around, produced a New York and New Jersey "Regional Transit Diagram" too.

It uses a form of the Vignelli  NYC subway map, which the system doesn't use today.

Probably they chose this as a way to have a familiar style without using the current NYC subway map design language to depict separate transit services in NJ.  But they didn't solve the fare media system problem.

Both the Mackler graphic and the MTA map show what we might call the "core" rapid transit system for New York City and the inner New Jersey communities that are tied to the city, but not the complete system.

It turns out that Joe Brennan has been producing Greater New York rail maps as a hobby for a couple decades.

He writes about the map creation process here.

The most current map shows all of the railroad and fixed rail transit services for both New York and New Jersey, although it doesn't depict the full system on the north and south, although these areas are outside of the defined New York City region).

As a result, the map doesn't include Metro-North services in Connecticut either.  (The separate MTA railroad map for Metro-North shows the complete MTA route network in NY State, NJ and CT--two lines from Penn Station serve New Jersey and parts of New York State, while all the other Metro-North services emanate from Grand Central Station.)

The integrated map is a great way to show what services are available and what could be possible if MTA, NJTransit, and PATH functioned within an integrated fare media system.

Subway Nut website.  Separately, the Subway Nut website has photos for most of the stations that are depicted on these maps.

A note on mapping rail transit services in Greater Philadelphia.  The SEPTA map goes a fair distance towards providing an integrated map for Grleater Philadelphia, but it doesn't go all the way. It shows SEPTA services primarily but does include the PATCO line and acknowledges NJTransit rail services.

Because SEPTA serves Trenton, NJ and Wilmington and Newark in Delaware it depicts those areas on the map.

By adding the River Line light rail line between Trenton and Camden, and the NJTransit Atlantic City Line (shown on the NJTransit rail map), they'd have a more complete Greater Philadelphia rail transit map comparable to the maps produced by Joe Brennan, MTA, and Mattias Mackler for New York City.

However, Peter Dovak, who does cartography and graphic design for the Greater Greater Washington website, has produced such a map for Philadelphia.  (And for DC-Baltimore.)

Labels: , , , , , ,

Friday, June 07, 2013

The other reason this old Capital Transit map is cool

The copy of this 1946 map I have is sadly, very very ratty, full of holes. But hopefully I will replace it with a better copy later.

The cool thing about this portion of the map that I have shown is that it depicts service to Rosslyn, Virginia being provided via the DC streetcar network.

This is an issue with the current "premium" transit service planning initiative underway covering the area from Union Station to Georgetown.   The planning effort doesn't seem to raise a connection to the Rosslyn Metro Station as an element, even though Circulator service does dip into Rosslyn now.  (Starting in 2006, I suggested that streetcar planning and Circulator service include Rosslyn.)

Back then, the DC streetcar lines, except for the 82/84 serving Rhode Island Avenue in Prince George's County and the 20 line serving the Glen Echo Amusement Park, pretty much terminated in DC. The streetcar lines serving Wisconsin Avenue and Connecticut Avenue stopped at the Maryland border. So did the line on Georgia Avenue.  (A branch of this line also went to Takoma DC, ending at 4th and Butternut Streets, about one block from the old train station.)

Right: the Capital Transit maps in the 1940s had more interesting coloration than later maps.  This section of the map shows service in Downtown.

In 1946, the Rosslyn service was provided by the 10 line, which served H Street, starting from Deanwood. According to a comment made at the H Street planning sessions in 2002, back then you could get to Rosslyn from H Street in 15 minutes by streetcar.

As various streetcar lines were abandoned, Rosslyn service was provided by different lines, including the 20 line (which went to Glen Echo) and the 80 line (which then terminated in Brookland). 

Labels: , , ,

Wednesday, February 27, 2013

Fun transit stuff

1.  I am definitely into maps and other travel ephemera, especially in how it communicates about the development of the automobility system.  (I use the example of creating this system when I discuss how sustainable mobility, especially biking, needs to be supported in an equivalent way.)

Right now I am in the midst of a "long term" project of collecting maps, postcards and related materials that illustrate how the "Recreational Auto Era" was developed through the creation of a support system (motels, service stations, maps, connected routes such as turnpikes, tourist information, etc.) for driving medium and long distances, and the transition from this period to what Muller calls the Metropolitan City as well as the Interstate Highway system.

Unrelated to that project, there is a website called Obsessionistas about people and their collections, and they have a great feature on designer Kate Farley, and her collection of UK maps, London Transport especially.

2.  In the last week, I've scored 1942, 1950, and 1962 maps of the Capital Transit system/DC Transit system.  (I already have 1954 and 1960ish maps.)  Even looking at them briefly, they've provided some insight into testimony I hope to submit with regard to NCPC's draft Visitor and Commemoration Element.  (Public comments due by 3/15/2013.)

3.  Speaking of visitor transportation systems, for the National Park Service visitor transportation study conducted starting around 2003, the Volpe Transportation Center did a report for NPS on visitor transportation systems in Boston, Orlando, London, Philadelphia, and Savannah.  This is also worth looking at in relation to NCPC's draft Visitor and Commemoration Element.

4.  CNN has a feature on the best Metro systems in the world, "What are the world's best metro systems?."

5.  ... and the best Metro stations in Europe ("Europe's most beautiful metro stations: From minimalist to ornate, innovative to wacky, these subterranean gems invite commuters to linger").  Although the Daily Telegraph has its own list as well, "The most impressive underground railway stations in Europe."

6.  Plus this year is the 150th anniversary of the London Underground.  See "Going Underground" and "The London Underground celebrates 100 years" from the Daily Telegraph.  (There are links to other articles within each piece.)

There are many great books on the London Transport system and UK railroads and the development of their pathbreaking marketing and design programs. One such book is London Transport Posters: A Century of Art and Design, which has a great set of chapters and lots of cites to older publications (which someday I hope to get around to reading).

7.  The American Public Transportation Association picked SEPTA of Greater Philadelphia as the best public transit system in 2012 and the Philadelphia Inquirer has a good article about the transformation of the system over the past 10 years, "How Philadelphia's Transit System Became the Best."

8.  Governing Magazine has some good stories, "When Will the U.S. Build Another Subway?," "Top Reasons People Stop Using Public Transit" and "Seoul's Transit System Serves as a Model for America."

9.  I already mentioned that this month is the 100th anniversary of Grand Central Station.

Labels: , , , ,

Sunday, February 10, 2013

National Park Service high resolution map of owned properties in DC

The advocacy group, Government Attic, focuses on getting and providing access to government documents. They turned up a high resolution map of the National Park Service lands in DC.

MAP A: A high resolution map of the Park System of the Nations Capital and Environs under Jurisdiction of National Capital Region - National Park Service, United States Department of Interior, (NPS 869/80,251-I), November 2008 - PDF 19.8MB

Labels: , ,

Monday, August 20, 2012

Washington DC road map, 1966 edition from Shell Oil

Washington DC Shell Oil map, 1966 The reason this map is particularly interesting is how back in the day, road maps often showed proposed routes for Interstate highways either under construction or planned.

By this time, the continuation of I-70 (now I-270) to Union Station, along the Metropolitan Branch railroad, must have been scuttled, since it isn't shown on the map.

If you look closely at the bottom of the first image, you can see how I-66 was proposed to continue as a kind of beltway around the inner core of the city, with a routing just below U Street NW, connecting to I-95 around Florida Avenue.

I-95 was supposed to come from College Park to the DC/Maryland border around Michigan Avenue/Queens Chapel Road, and from there

I-295 was supposed to be west of its current routing, and then was to be routed through Langston Golf Course, Trinidad, and the Ivy City Railyard up along the Metropolitan Branch Railroad line, and then through the Fort Circle Parks greenway back to Queens Chapel Road.

The way that transportation planning worked back then, the subway and the freeways were planned simultaneously, e.g., how the subway is in the middle of I-66 once it leaves Arlington County in Virginia. Similarly, the red line was supposed to be bracketed by I-70, and the green line section in northern Prince George's County was supposed to be bracketed by I-95.

If you look at how much of the city was supposed to be destroyed by freeways, imagine all those sections of the city functioning something like the areas around the Southeast-Southwest Freeway (until recently) or South Capitol Street.

Washington DC Shell Oil map, 1966

Washington DC Shell Oil map, 1966

Labels: , , ,

Saturday, June 16, 2012

Civic Data Challenge Invites Entrants to Turn Civic Health Data Into Useful Applications and Visualizations

From email:

Presented by the National Conference on Citizenship in partnership with the John S. and James L. Knight Foundation, the Civic Data Challenge invites participants to turn existing civic health and community attachment data into applications and visualizations that make the information more valuable and accessible to decision makers and the public. 

The challenge seeks participants who can turn the raw data of "civic health" into beautiful, useful applications and visualizations, enabling communities to be better understood and positioned to thrive. The challenge's organizers hope that it will lead to new findings that illuminate why community engagement and attachment are critical to the development of thriving communities.

Challenge participants who analyze and create visual representations of data will be eligible for various prizes. Designers, data scientists, researchers, and app developers are especially encouraged to participate. 

Challenge participants will be provided with civic health and community attachment data, as well as data on health, safety, education, and the economy. Participants will analyze the data, identify connections and correlations, and create visual representations and interactive products to showcase their findings. These may include infographics, apps, animations, videos, or other products.

For more information, check out the Civic Data Challenge webpage.

--------
It wouldn't be particularly scintillating in terms of data-based graphic interpretation, but four big issues for me in terms of so-called "civic health" are:

(1) presence of traditional (print, broadcast, etc.) community media in communities and the access that residents, citizens, and people with alternative perspectives have to these vehicles.

So in DC, I'd say that neighborhoods (Georgetown, Dupont Circle, Upper Northwest, etc.) are better served because they have access to--and in some neighborhoods it's delivered door-to-door--the Current Newspapers, which are published weekly.  This is better compared to Greater Capitol Hill, because there the Hill Rag is published only once/month.  But many neighborhoods lack this kind of vehicle.

In Mount Pleasant, they have a community radio station, Radio CPR.  Technically, there is also cable access television, which people can use, but there is limited information about what it is, how to use it, and what's being broadcasted.

Also see the work by community media scholar Robert McChesney, who teaches at the University of Illinois.

By comparison, in city-wide media, citizens have a bit more access to the Washington Times, the free Washington Examiner, and the alternative weekly, the Washington City Paper, than they do to the Washington Post and the free daily Express.  While the broadcast television stations mostly don't cover community news, just murders, accidents, and fires, and politicians.  However, the NewsChannel 8 24-hour cable channel does provide a few more options for community involvement, as do the programs on the local public radio station, WAMU.

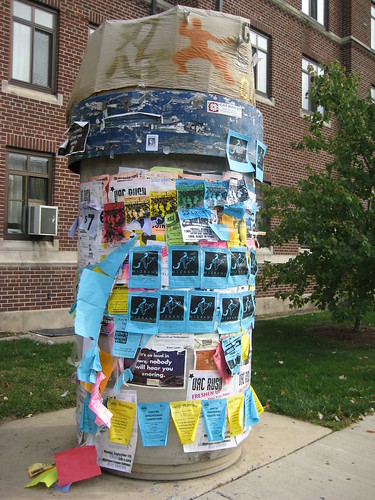
(2) Presence of community bulletin boards and kiosks, where people can independently post flyers and other information.
Kiosk
On the campus of the University of Michigan in Ann Arbor, so-called kiosks (an element of the underground steam heating system) are used by individuals and groups to post flyers and information.  Flickr image by NYC Comets.

(3) Presence and relative health of civic organizations, at two or three scales: the neighborhood and community-wide scale (e.g., the differences between what the Capitol Hill Restoration Society, a neighborhood group addresses and the DC Preservation League, which is a city-wide organization), along with the political district level (ward, councilmanic district, borough, etc.).  For example, the London Cycling Campaign and the Toronto Cyclists Union support organizing at the ward-borough level.

(4) Measures for substantive citizen connection to local government decision-making, such as the existence of Community Boards in New York City, Neighborhood Planning Unit organizations in Atlanta, the designated community planning groups in San Diego, the Neighborhood Councils in Los Angeles or Seattle, DC's Advisory Neighborhood Commissions, etc. AND measures of substantive access and input that these organizations have.

Labels: , , , , ,

Friday, September 23, 2011

Joseph Passonneau (obituary)

Image of the bike path along Interstate 70 in Glenwood Canyon, Colorado. From Rocky Mountain Scenery.

Yesterday's Washington Post ran an obituary for Joseph Passonneau, one of the city's leading urban designers.

He is known for his work on DC urban design issues--e.g., he suggested that the Southeast-Southwest Freeway be converted to an at-surface boulevard, and is the author of Washington through Two Centuries: A History in Maps and Images, although the book is focused on the central business district (Downtown), and it has a great set of maps of the district at different points over the past 200 years.

And in the Catholic U architecture library, I came across the Central Washington Transportation and Civic Design Study from 1977, which had, among other graphics, this one, which I publish in various blog entries from time to time.
Mobility efficiency -- Passonneau

But the obituary, and two from St. Louis, "Joseph Passonneau dies, architect who fought to build Arch" (St. Louis Post-Dispatch,) and "Joseph Passonneau: Architect and engineer who designed part of interstate highway system" (far more detailed than the others, from the St. Louis Beacon), informed me about stuff I didn't know, that he had been dean of the school of architecture at Washington University in St. Louis, and he was instrumental in the development of the Gateway Arch there.

Plus, I had no idea he was one of the lead designers of the Glenwood Canyon section of Interstate 70 in Colorado (see "Glenwood Canyon 12 Years Later" from Public Roads. From the standpoint of integrating bicycling as a mode of transportation, and providing connections to park resources, this freeway project is an outlier in the history of U.S. freeway building--the only fault I have "with the project" is that for whatever reason, the Federal Highway Administration didn't capture these practices and processes and communicate them far and wide to the highway departments in other states.

From the St. Louis Beacon article:

Glenwood Canyon in Colorado has been the primary route through the Rocky Mountains since before wagon trains gave way to the iron horse. But a 30-year controversy over environmental concerns, aesthetics and economics kept the canyon outside of the interstate highway system until 1992. Finally, a long-planned engineering feat by Passonneau and fellow architect Edgardo Contin transformed the 2000-foot-deep I-70 passageway into a transportation work of art.

"It's a monumental accomplishment of great beauty and engineering skill," said Eugene Mackey III, an architect and former student of Mr. Passonneau. "His negotiation with the public was also an extraordinary accomplishment."

The canyon highway's final design included 40 bridges and viaducts, five tunnel bores (traffic openings) and 15 miles of retaining walls for a stretch of freeway 12 miles long.

In 2000, Mr. Passonneau received the Presidential Award for Design Excellence from President Bill Clinton for the canyon work.

Mr. Passonneau's daughter said the beauty of the Glenwood Canyon project epitomized her father's philosophy of his work. "He wanted to ensure that the ecological impact was minimal," Polly Passonneau said. "His maximum focus was on the human."

Labels: , , ,

Friday, September 09, 2011

Spider map concept for WMATA

Map image by Peter Dunn.

At Greater Greater Washington, Peter Dunn introduces a spider map concept for local bus service. It happens that this particular area of his demonstration map, H Street NE, only has WMATA bus service, but in other parts of the city and other areas in the metropolitan area, there would be additional local services available.

Based on what they do in London, it's really a great concept. See "H Street bus "spider map" can demystify bus service," which is in part an extension of this GGW post, "Would personalized "spider maps" be useful for DC?."

Also see these past blog entries:

- DC as "Metro-Land" vs. constrained transit planning
- Nonbicyclist using map at bicycle sharing station

I thought I had written about these types of maps in the context of DC and wayfinding systems but can't find a posting, it might just have been in the comments section of various entries.

Labels: , , , ,

Sunday, May 01, 2011

Incremental change can be as easy as starting with a sign

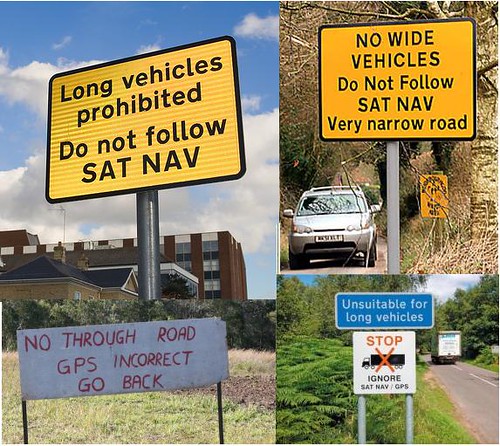
anti-sat-nav-road-sign

RoadsignWNS_468x741
Personally, I don't think this sign is very explanatory... (Image credits to come.)

I thought it was pretty funny to read an article in the Examiner, "Faulty GPS makes Va. neighborhood a truck obstacle course" about how bad GPS directions for the area around Rte. 1 in Fairfax County are directing large trucks into streets unable to accommodate them. Residents are calling for the streets to be declared closed to trucks.

But because most local roads are under the control of the Virginia Department of Transportation, it is a relatively long process to get such a regulation in place.

The same thing happens in many other places. In the UK, they've created signs to warn drivers when GPS directions are incorrect.

Why not start with a sign? You can do one for under $200...

From the article:

Stranded semi-trucks, sent astray by errant GPS systems, have fouled up a tiny 1940s-era neighborhood tucked between South King's Highway and Route 1 in Alexandria, leaving Fairfax County and the state to find a fix for fallible technology.

Several times a month, tractor-trailers and other enormous vehicles miss a tricky turn from North King's Highway onto traffic-heavy Route 1, home to mega-destinations like Target, Office Depot and Lowe's. Instead, the vehicles wind up on South King's Highway, neighborhood resident Edward Walker recently told the Fairfax County Board of Supervisors. From there, GPS technology sends the truckers on a shortcut back to Route 1 - on narrow, steep Pickett and Franklin streets, where the trucks and buses simply can't fit.

Walker approached county supervisors armed with photos of a truck jack-knifed, another in a ditch, another forced to back out onto busy South King's Highway, as well as pictures of broken trees, mangled fences and rutted lawns. ...

A fix likely won't arrive for nearly a year, however. First, VDOT has to study the county's no-truck recommendation, and then GPS companies need to get around to updating their systems. That's a quarterly process, said a spokeswoman for Garmin International Inc., a GPS manufacturer. Companies then rely on the GPS owner's diligence in downloading updates.

Labels: , , , ,

Monday, March 28, 2011

Civic engagement, redistricting, and who knows what else...


David Alpert of Greater Greater Washington created a nifty application, the "Redistricting Game," that allows anyone with access to a computer to weigh in on the Ward redistricting process in DC.

Others have developed similar applications for use at the state level, such as in Virginia, which likely piqued David's interest. See "Va. redistricting likely to shift power north: Some sitting lawmakers could be drawn out of their territories" from the Washington Post and the Redistricting Game website for state-based redistricting from the USC Annenberg Center.

I used it myself over the weekend (my home computer and wifi system is finally now working again) and found with just a few changes--I can't remember exactly, but moving one block group from Ward 8 to Ward 7, one or two from Ward 6 to Ward 7, and a handful from Ward 2 to Ward 6--Ward 2 has lots of downtown real estate under its domain although just a handful of people live in many of these block groups--maybe 8 in total, you can accomplish all that is necessary for redistricting with minimal changes, without changing the boundaries of Wards 1, 3, 4, and 5.

Sadly, the Washington City Paper's Housing Complex blog reports in "The Committee of 100′s P.R. Problem," that somehow this interesting web application is seen by the Committee of 100 on the Federal City as a toy and demeaning of the seriousness of the civic engagement process--this despite the various iterations of web-based redistricting applications created across the country by universities and other organizations.

I myself am sometimes torn about web-based engagement. It can be deep with great breadth. It can be incredibly glib and pathetic. But there is no question that it allows for greater communication and engagement if the processes are robust. And for applications that are map (GIS) based, there is no better way to do it.

It's sad that the C100 doesn't see this and makes themselves look like Luddites in the process. Generally, I believe it is best for organizations to change with the times. Certainly, NYC's Municipal Arts Society shows that a civic organization can be around for more than 100 years and remain incredibly innovative and engaged.

DC's civil society is weak by comparison, at least in terms of organized groups, and that is a shame.

Labels: , , ,

Wednesday, February 16, 2011

Walk Bike Transit Mode Split By Congressional District

Walk Bike Transit By Congressional District
Speaking of mapping, John Boyle, the Research Director of the Bicycle Coalition of Greater Philadelphia created a map that allows you to view different modes or see walk/bike and walk/bike/transit combined, organized by congressional district.

Map - Walk Bike Transit Mode Split By Congressional District

Labels: , , , , , ,

Thursday, November 25, 2010

New WMATA station area map, Metro Center

I have discussed the WMATA maps before, which generally are pretty good, but have one glaring glaring omission that make it hard for commercial districts to benefit from transit and transit maps.

For some reason, government agencies are very very very very very reticent about listing "for profit" entities on maps, even if these are high profile activity centers and destinations with high attraction for transit users, such as grocery stores.

So these maps don't list key commercial destinations. (I have photos of the maps for Metro Center, King Street, and Bethesda.) In the Metro Center area, the map does includes the Downtown Macy's Department store, but in neighborhood stations like at Takoma, the nearby and adjacent commercial district is not included, nor are grocery stores.

This makes no sense.

The categories that WMATA includes on the maps are:

- Places of Interest (historic and other sites)
- Civic/Government Buildings
- Transportation sites (such as other subway stations)
- Hospitals/Medical Centers
- Schools/Colleges/Universities
- Parks/Open Space

Now, this isn't a station area map in the same way, but STM in Montreal has more fanciful station area maps that identify destinations around subway stops, including commercial districts.
Station area map, Montreal subway
Station area map, Montreal subway, Guy Concordia station

The travel book publisher Ulysses publishes a travel guide to Montreal based on these maps.

Labels: , ,

Sunday, June 13, 2010

Two good articles in Mass Transit Magazine

1. Reducing Risk By Michael Conlon and Brenda Himrich of the Minneapolis Metro Transit system, is about a safety campaign designed to reduce distracted driving on the part of bus drivers in their bus service.

When the system discovered that a bus driver was using a cell phone when getting into an accident with a bicyclist, they decided to develop an integrated campaign using internal media, training, and evaluation systems to reduce distracted driving--and accidents--by drivers. The media also ended up being repurposed as part of external communications programs.

The reason I find this article important is all the myriad of problems with safety that have been experienced over the past year with the WMATA system, and the need to develop an integrated and thorough response.

The Minneapolis transit system also quantified the financial benefits from accident reduction (as much as $30,000 for each accident eliminated). In the DC region it would be more, because so many of the accidents end up generating large settlements or legal awards.

2. Routing Culture By Tim Newcomb, is about transit system maps, objectives, communicating information, and schematic vs. geographic maps. From reading the comments, most of the map designers seem to be less focused on communicating broader information to occasional users.

Labels: , ,

Wednesday, January 20, 2010

Level of Service and Level of Quality aren't just concepts from transportation planning

Yesterday's Post has a story about the debacle of providing benefits and services to people receiving various health and welfare benefits, "D.C.'s stressed aid centers are a stressor for poor residents." From the article:

City officials say a combination of recent budget cuts and the continued economic slowdown have led to extended waiting times. Last year, the administration of Mayor Adrian M. Fenty (D) closed two of the seven IMA service centers to save a little under $1 million. Although the administration pledged that the remaining centers would be wellstaffed, District officials say those promises have been stymied by the recession, which has limited the city's ability to hire workers.

At the same time, the Department of Human Services is facing a growing demand for services as the city's unemployment rate has climbed to 10 percent; in Ward 8, the figure is 28 percent. According to the U.S. Department of Agriculture, about 103,000 District residents participate in the food stamp program, a 22 percent increase since 2007.

City officials say they are working to hire more people, install self-service kiosks and redesign the Anacostia center.

Apparently DC Government closed at least 2 offices, and there aren't enough people at the other offices to deal with the demand.

Plus people have to travel a long time to get to the offices, because they are located far from where they live.

Plus people are required to come back the next day after waiting all day and not receiving service.

It's appalling. And for all the talk about customer service on the part of local government (which, by the way, usually comes at the diminution of the role of the citizen as a citizen who empowers the process of governance to begin with) clearly there is a major disconnect.

With simple GIS analysis (and the DC Government is replete with GIS resources) you can determine where your "customers" are located, and the level of transit service from those areas, and how long it takes to travel.

Location decisions should be based on the most simple way to serve customers, not on the convenience of government, and hopefully not as part of an unstated policy to deliberately dis-serve people to make government hard to get to, to reduce the likelihood of having to provide service.

And people who are not served and have to return should be receiving priority timed appointments for their return visit, rather than having to wait in a cattle call.

Etc.

Clearly, the "$1 million" in savings will be offset in time losses on the part of service recipients (customers) not to mention the increased cost of required improvements at the extant locations.
http://blog.case.edu/msass/2008/11/11/Poverty_Center_food_stamp_map_series_8x10.jpg
This is a map of food stamp recipients by sub areas of counties in Northern Ohio, produced by a research unit, the Center on Urban Poverty and Community Development, at Case Western Reserve University. Obviously, this type of data can be provided at any level, and must exist within DC, and should be easily obtainable.

Overlaying the data with service center locations is a simple process.

Too bad that the Washington Post didn't attempt to do GIS analysis and the production of relevant map graphics this as part of the article, which would have made the problem very easy to understand and to address. Maybe they didn't think to do it. Maybe budget cuts meant that they didn't have the resources to do it.

One interesting thing about municipally-owned utilities is that it provides a revenue stream that can support the provision of local offices in a city. Seattle Power and Light is municipally owned, and often co-locates payment centers with District Courts and Libraries.

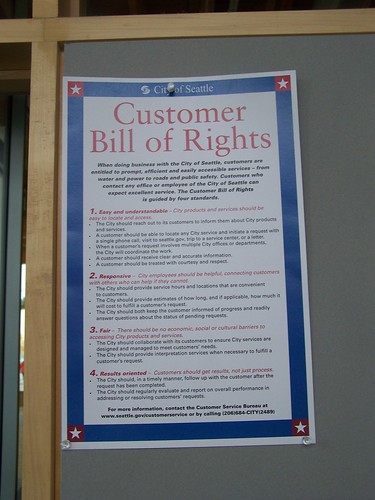
This Customer Bill of Rights was on a bulletin board in the service center connected to the public library in the Ballard neighborhood.
Customer Bill of Rights: City of Seattle
Clearly, "easy and understandable," "responsive," "fair," and "results-oriented" customer service is not yet part of the ethos of DC Government.

Labels: , , , ,

Monday, November 23, 2009

Transit-mobility stuff

1. Placemaking Institute calls our attention to this September article from the Toronto Star about a condo building constructed with no automobile parking for individual units, but including 315 spaces for bicycles and 9 carsharing spots. See "'Car-free' condo: 42 storeys, no parking: University Ave. project with 315 bicycle spots touted as green model."

I suggested something similar for construction on the land that WMATA wants to sell at the Takoma Station--constructing a multiunit apartment or condo building with no parking for individually owned automobiles, only for shared cars like Zipcar, plus structured parking to support the subway station (ugh) and the commercial distict in both DC and Takoma Park, Maryland. Instead the proposal is to build rowhouses with one to two spaces each for automobiles. (See the 2006 testimony in this blog entry, "Comments on Proposed EYA Development at Takoma Metro.")

Maybe we'll start to see developments marketing their access to bicycle trails and routes? Also see the AP story,Realtors peddle homes to bike-happy clients."
2. The Toronto Star map project has updated its maps on commuting behavior. See "Map of the Week: How we commute, redux," with maps of driving, transit, walking, and bicycling trip data, based on the Canadian Census. Of course, walking and transit use is highest in the core of the city, and driving is more typical the further people live from the core of the Toronto region.

3. If such maps were produced for Seattle, they would likely demonstrate why the idea to pull Seattle transit services out of the King County Metro system might make sense, without changes on the part of King County Metro. According to this entry from the Seattle Post-Intelligencer, "Do we need to pull Seattle Transit out of Metro?":

If the King County Council, dominated by eastside and southside conservative members, insists that Seattle take the lion's share of service cuts, even though in-City buses are already stuffed to the gills, the City of Seattle needs to look seriously at pulling its assets out of Metro and re-establishing Seattle Transit to run in-City (non-suburban) transit service.

As the Toronto maps show, the highest incidence of walking, bicycling, and taking transit to work is in the core of the city. In Seattle's case, there is no question that the bulk of riders on the bus system are Seattle residents. So it doesn't make sense to cut bus service in the places where it is most used, in favor of areas with comparatively less use. The King County Council should make the right decision, based on use, not a political decision that misuses limited public resources.

4. Hip city transportation officials and politicians in Seattle led a "Pedestrian safety dance" (from the P-I) to the song "Men Without Hats" to promote pedestrian safety. See the entry for video from the event.

5. Montgomery County Maryland has three very nice bicycling-sustainable transportation maps for White Oak, Silver Spring, and the Medical Center (National Institutes of Health and the Bethesda National Naval Hospital). These maps are models for promoting bicycling and optimal mobility in key destinations.

6. Although the NoMA Business Improvement District in DC is also doing a nice job of promoting bicycling.

7. I did my first presentation on biking and walking and the County's bicycle and pedestrian planning process for my job. I am positioning the study process along the lines of civic identity and quality of life, rather than bicycling and walking per se. Some points from my presentation outline:

--------
How to Do it/Citizen involvement/A more robust planning process

a. Defining your civic identity and sense of place. Question: What kind of community do you want to live in? Making choices. Fred Kent from PPS: “if you design communities for roads and traffic, you get lots of cars and traffic. If you design communities for people and places, you get people and places.”

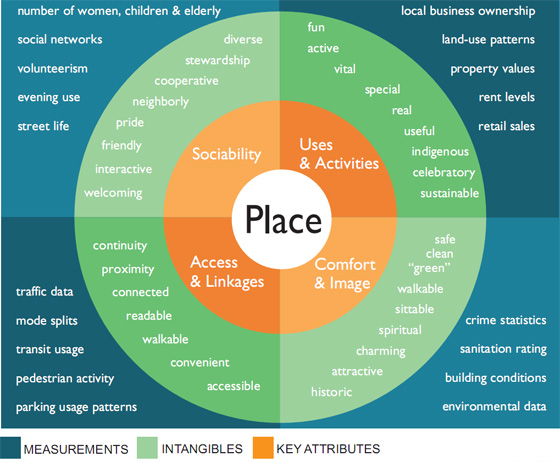
b. Focus on Placemaking (Access; Comfort & Image; Uses & Activities; Sociability). [Based on Project for Public Spaces ideas, e.g., "Qualities of Great Streets."}
http://www.placemakingchicago.com/cmsimages/place-diagram.jpg

For this PPS diagram and more information, see Four key qualities of a successful place from the Metropolitan Planning Council of Chicago initiative with PPS, Placemaking Chicago.

c. Triangulation: considering needs from at least three vantage points. Multiple perspectives ensures a more accurate assessment of community needs and helps to make choices and set community priorities. (This is a concept applied by David Barth of Glatting Jackson in best practices park planning. See "Parks System Master Plans: Tools for Sustainable Communities.")

d. Active Citizenship. Civic engagement, building support organizations, and the county commitment to walking and bicycling (and transit and transportation demand management and sustainable transportation) by involving concerned and interested citizens more directly.

e. It is important for citizens to not only improve their own household's mobility behaviors while advocating for neighborhood improvements while at the same time simultaneously supporting and advocating for improvements in the walking and bicycling environment throughout the County, and expansion of a connected regional network of recreational trails/greenways.
f. Necessary for residents, elected and appointed officials, government agencies to be on the same page in terms of focusing on placemaking and the importance of bicycling and walking in terms of extending the quality of life and livability in the community, making the County more attractive to investors, businesses, students, and visitors.
-------

This is designed to get away from the idea of bicyclists and walkers as "the other" in a County where probably 95% of households have cars, and fewer than 7% of trips to work are made by walking, bicycling, or transit. (In DC, it is over 50%, in Montgomery County, it is.)

(See the past blog entry, "Deja vu all over again: the "other" as trail user" which describes a general problem of perception that I have to deal with in the planning process I am managing in order to achieve the goals that I have set out for myself.)

And it is an opportunity for me to shape the planning and public participation process in ways that I wish similar processes had been conducted in planning studies that I have participated in as a citizen or as a stakeholder in DC, but where I wasn't able to shape substantively the scope of work or organization of the study or process.

8. Interesting article in the Philadelphia Inquirer, "Freewheelers," about the "Old Spokes" bicycling club made up of residents of the Normandy Farms Estate retirement community in Blue Bell, Pennsylvania. I intend to use this when dealing with the "cyclists as criminals" arguments that people raise.

9. And I like what Rails to Trails Conservancy did (they have a contract from DC DOT) to do promotion in association with the Metropolitan Branch Trail in DC. See "Children journey into a new world: With 40 free bikes, Rail-to-Trail Conservancy encourages youths to explore eight-mile path" from the Post about how RTC has distributed bicycles to children in neighborhoods abutting the trail.

Labels: , , , , , , ,

Friday, September 18, 2009

Easy print (8.5x14) retail directory of the Florida Market

In preparation for the Florida Market retail tour tomorrow, as part of WalkingTown DC, designer Christopher Taylor Edwards has prepared an 8.5x14 (print on both sides) map and directory of the market.

In the past we have given out an 11x17 version of the prototype sign that we have, which is 32x48 inches, the same size as the wayfinding-cultural interpretation signs that have been erected around the city. But the text is too small and it doesn't really work in a black and white print.

This version is still designed in color but prints fairly well in black and white.

Florida Market Directory Handout

Labels: , , , ,

Tuesday, September 01, 2009

Mapping bicycle-car and pedestrian-car accidents

Bicycle crash
May 28, 2008. Bicycle accident just north of Parliament above Lakeshore. Smashed windshield on the Toyota with bicycle in foreground..also passing cyclists. Cyclist taken to St. Michaels Hospital. Cyclist passing by looking at the accident. Toronto Star/Michael Stuparyk

The Toronto Star has a feature each week, where they map various aspects of life in the city. This week's maps are on crime:

  • Map: Breaking and entering rates
  • Map: Change in breaking and entering, 2004-8

  • And just last week, including a feature in the printed newspaper (most of the map features are exclusive to the web), they produced a "definitive" map of Toronto's neighborhoods. See "We define ourselves by our neighbourhoods" and the map, Interactive map: Toronto neighbourhoods.

    Their previously produced maps on bicycle and pedestrian accidents are interesting, because until this kind of data is produced regularly, made public, and analyzed, it is difficult to move practice forward and improve the situation.

    This is true especially in light of the discussion in Greater Greater Washington around the removal of the ghost bike memorial to Alice Swanson, who was hit by a truck and killed last year, at the intersection of 19th and R Streets NW. See "R-E-S-P-E-C-T, that's what the ghost bike means to me."

    The entry makes clear that the driver was at fault, turning right from the leftmost part of the street, but the accident report produced by the Police Department does not fault the driver, but instead, the bicyclist. From the entry:

    Swanson's family and bicycle advocates have also been trying to get a copy of the police report. Thus far, the police have refused. WashCycle got an informal look at a redacted version, where the police seem to go out of their way to blame the cyclist for getting hit. The investigating officer concludes that the truck driver didn't violate any laws, but, according to WashCycle, implies that Swanson violated the law against moving faster than is "reasonable and prudent." (...)

    Meanwhile, the truck apparently did break the law, whether or not the police particularly care about said law. If you're turning right in a car, and there is a bicycle lane, you are supposed to move into the bicycle lane before making the turn. You should signal and look over your shoulder to move into the lane, just as if there were a regular car lane to the right. Turning from the car lane is the same as making a right turn from the left-hand lane when there are two regular lanes. It's illegal.

    For all the talk of "Wiki Government" and "Apps for Democracy," this kind of very basic mapping (along with public posting of statistics and management by data evaluation efforts, such as is done in the Baltimore Citistat program) strikes me as something that should be being done anyway--a matter of course and standard procedure--by government. (The Vancouver Sun has an interesting map on where parking tickets were written and for what offense.)

    Certainly this is something more technically adept people than I could work to produce for DC. A map like this should be added to the region's premier blog on bicycling, Washcycle and the websites of various bicycling and pedestrian advocacy organizations.

    -- Map of the Week: Bike accidents (Toronto Star, March 19, 2009)
    -- Map of the Week: Pedestrian accidents (Toronto Star, March 27, 2009)

    Labels: , , , ,

    Friday, March 20, 2009

    Cities of the World

    Cities of the World book
    The Space Design Journal, in "Taschen's Gorgeous "New" Planning Book," calls our attention to an incredible picture book, with "564 plans, bird's-eye views, and map views of all major cities in Europe, plus important cities in Asia, Africa, and Latin America," dating from 1572-1617.

    It illustrates a point that I make often, that while every place is unique, the systems of urban design work similarly from place to place. This is why places can be compared, and lessons learned, despite the "fact" that every place is "unique." When "uniqueness" is used as an excuse to not be able to compare "different" places it is merely an excuse for mediocrity.

    I was also thinking about "battles" over the years, when proponents of various projects would argue that exceptions from basic urban design principles were in order, for whatever reasons.

    Thus far, in heavy involvement in planning issues for about 9 years, I can't think of one instance that justifies deviating from basic principles of urban design.

    For a good rundown of those basic principles, see the Urban Design Compendium.

    Labels: , ,

    Tuesday, September 30, 2008

    You can change things...

    Well, about 5 months after I pointed out to Google Maps that they had the location of the New York Avenue Metro Station in the wrong place (they showed it before approximately at the equivalent of 2nd Street NE and New York Avenue, when it is located at 200 Florida Avenue, with another exit at 201 M Street NE), they fixed the location.

    When you see problems such as these, report them.

    It's a "little" thing, but for people who wouldn't know, it makes a big difference.

    Labels: ,

    Tuesday, September 16, 2008

    Sharing the road and promoting bicycling

    Bikesharing at Adams Morgan Day 2008
    Bikesharing at Adams Morgan Day 2008

    From "A roadway to share" in the Huntsville Times (Alabama):

    Motorists should be aware that it is not lawful to harass bicyclists, to run them off the road or to throw things at them. Motorists should also be aware of the roads and streets officially labeled as bike routes. (One of those runs through Research Park.)

    I have been thinking about this lately, that there need to be more reminders of this--questions on the test for drivers licenses, information on maps.

    I happened to receive in the mail yesterday the combined walking/cycling/public transit maps for the City of Melbourne, State of Victoria, in Australia. Victoria has one of the best transportation demand management programs in the world, called TravelSmart.

    Anyway, the two maps, one focused on "National Ride to Work Day 2008" and the other the everyday map, have great information on cycling in traffic, the famed "right hook" and other defensive bicycling information, and loads more information about transit, bicycle user groups, etc.

    So, since I picked up a number of other bicycle maps from the region, compliments of the Washington Area Bicyclist Association booth at Sunday's Adams-Morgan Day street festival, I discovered that most have similar information, even if I think the Australia info is better.

    Still, it leads to the next point, which is that we need to have bicycle maps converted into signage that can be displayed in bus shelters and subway stations, as well as at SmartBikeDC stations!!!!!
    SmartBikeDC station, 7th and F Streets NW, Washington, DC
    SmartBikeDC station, 7th and F Streets NW, Washington, DC (@ Arts on Foot)

    And each SmartBikeDC station needs explanatory signage about what it does.
    Make do sign explaining bikesharing
    Explanatory temporary signage for bikesharing at Arts on Foot, 2008, 7th and F Streets NW.

    I understand make-shift promotion efforts, but if someone like me and a good designer can make great wayfinding signage on our own time and money, certainly the DowntownDC BID, the DC Department of Transportation, or Clear Channel, the contractor for the bikesharing program, could manage to do this as well.
    Explore Florida Market directory and history signage

    Labels: , , , , ,